wandb.Run.log() when all logged values are of length one.
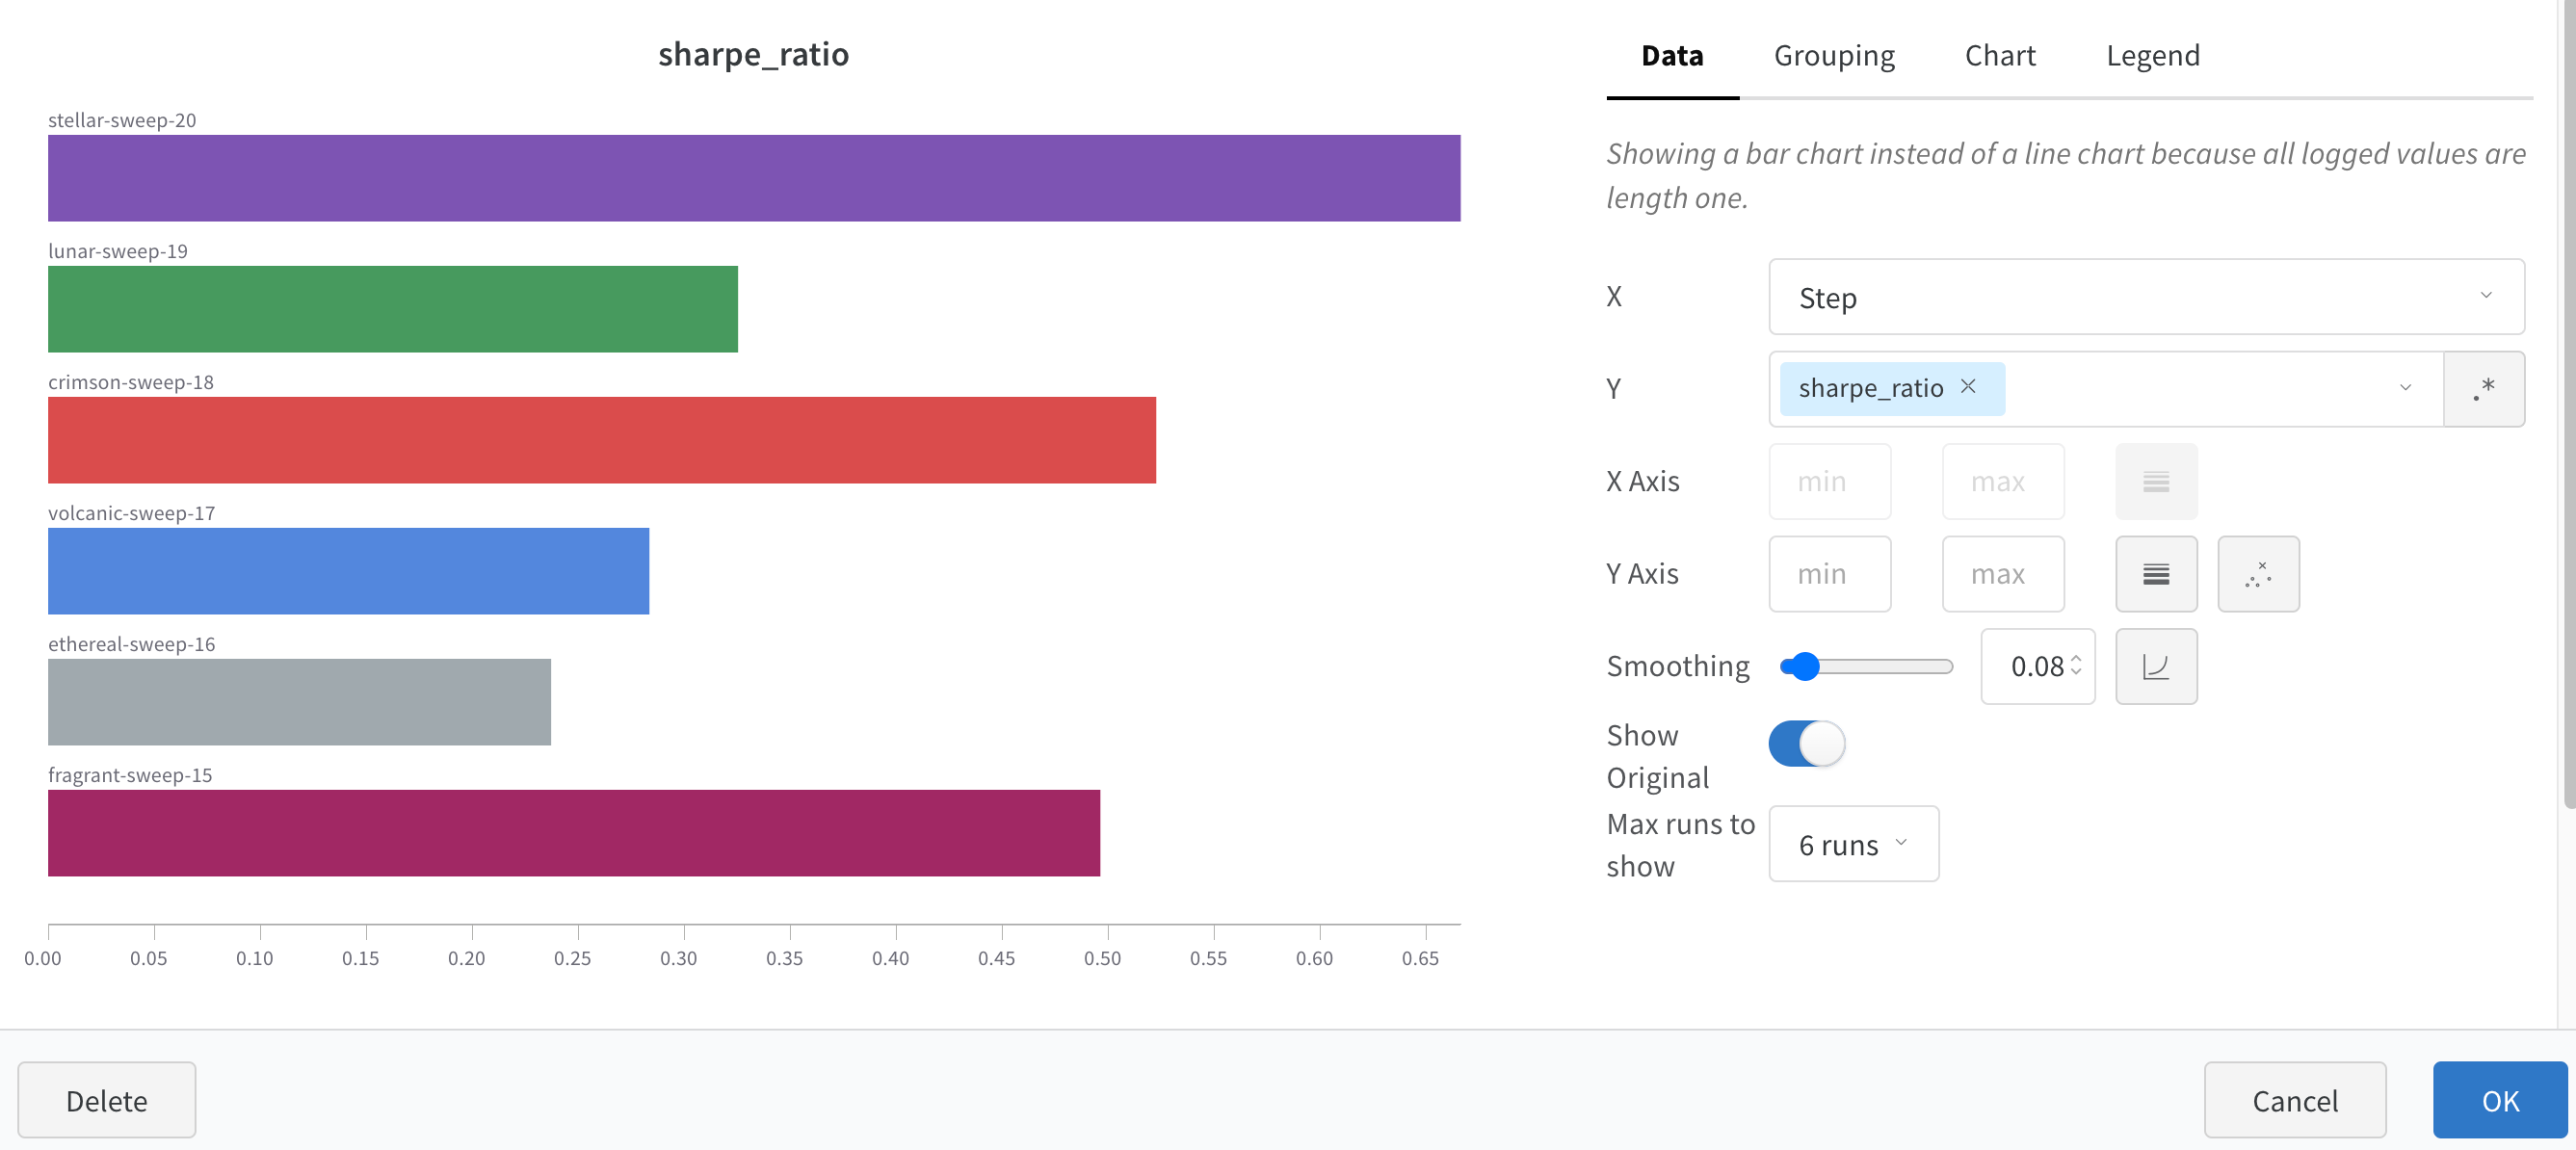
Customize bar plots
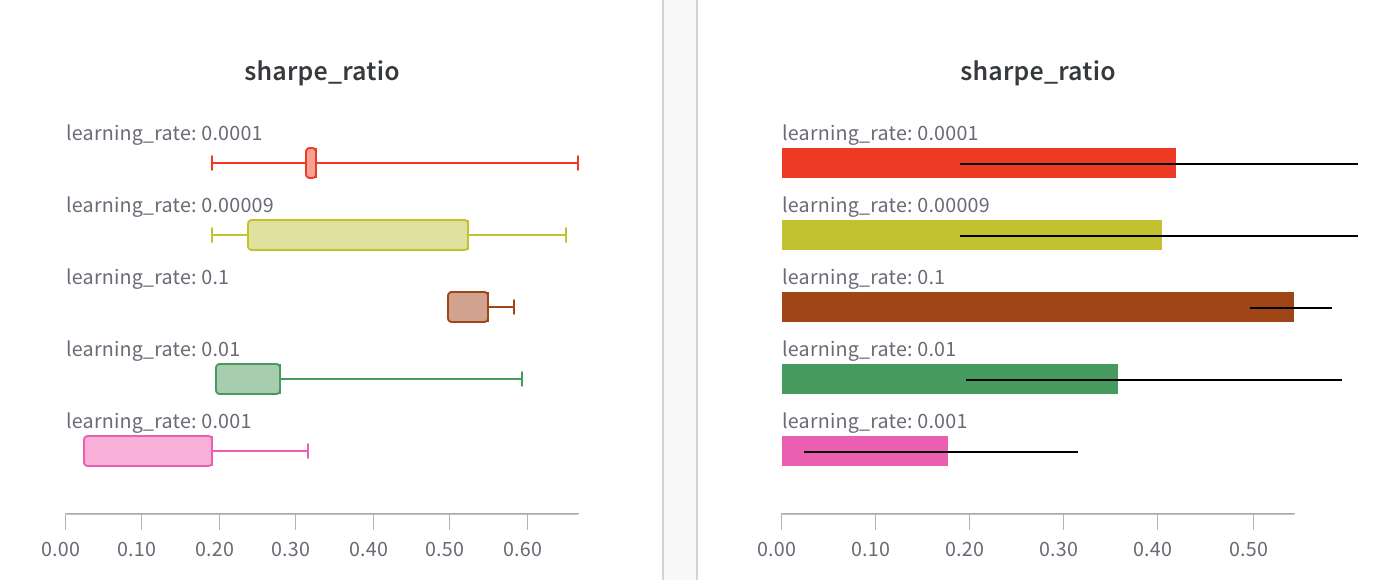
You can also create Box or Violin Plots to combine many summary statistics into one chart type**.**- Group runs via runs table.
- Click ‘Add panel’ in the workspace.
- Add a standard ‘Bar Chart’ and select the metric to plot.
- Under the ‘Grouping’ tab, pick ‘box plot’ or ‘Violin’, etc. to plot either of these styles.